In conclusion
- jaj160
- Dec 17, 2021
- 16 min read

"It is simply a very large rectangle."
"Dubai Frame", submitted for copyright registration in November 2016.
Rejected for the second and final time on November 29, 2017.
Greetings, and welcome to what will be the final report-back on my project for DSAM 3000. Throughout this course, I have used a topic modeling program called MALLET to see if such a tool could help me identify values inherent in copyright law. More specifically, I utilized a dataset comprised of rejection letters from the US Copyright Office Review Board - letters that were downloaded from an online database but originally sent to people and organizations seeking to appeal prior denials of copyright registration in submitted works. Utilizing these as a corpus to be analyzed, I subjected these to topic modeling and assessed the results to determine whether or not they were suggestive of value-driven priorities. In this post, I will discuss my progress and results before turning my attention to a reflection of my process throughout the course overall. The reason for this prioritization is two-fold: first, I have recounted the specific stages of my prior work in detail in previous iterations. Second, a major focus of DSAM 3000 has been reflection on our metacognitive processes. I want to prioritize that here because it is a priority of the class but also because the fourth iteration of my work was the one in which I think I learned the most.
My project began as one heavy in the technicalities. Getting MALLET installed on my computer involved a bit of struggle and getting my data prepared involved more than a bit of work. The data was actually comprised of pdfs, which had to be converted into .txt files in order to be read by the software. Conversion wasn't the only preparatory concern, however. MALLET uses a type of topic modeling that is based on latent Dirichlet allocation (LDA). It is considered unsupervised topic modeling, in that data is not manually tagged in any manner. However, because LDA relies on a generative probabilistic model, relationships between words and the frequencies of words affect the topics it produces. This means that the data needs to be stripped of encoded line breaks, for instance, that some words need to be trimmed and lemmatized into their roots (so "roots" becomes "root" and "swam" becomes "swum"); and that words that might throw off the balance - words that might be used with unusual frequency such that they throw off the probabilistic distributions - need to be removed via what is known as a "stopwords list". MALLET applies its own stopword list to remove commons words such as "and" and "the", but I initially added my own so that numbers - which in my dataset referred mostly to addresses and legal code (the former of which were irrelevant and the latter of which were unnecessary to retain as the content of the referenced code was discussed in text) – were also removed.
I then ran MALLET several times, changing the parameters so that I received sets of ten, five and three topics. As a bit of background: topics are described by many people in many different ways. In my reading I found Ted Underwood’s to be perhaps the most helpful: he writes of topics as existing across a corpus, assuming that the corpus shares some things – be those subject, language use, genre, or the like – in common. Topics are distributed in unequal proportions across the documents that make up the corpus, and each document can contain a variety of topics to varying degrees. According to Underwood, a topic can also “be understood as a collection of words that have different probabilities of appearance in passages discussing the topic.”[i] Another way of thinking about them, especially given that they are the products of a generative probabilistic model, is that they are a grouping of words from which the documents comprising a corpus could have been generated. Some topics are more strongly represented across particular documents, meaning that there is a higher chance that a document could be generated from the terms in some topics than others.
Validating one’s returns is a challenge – especially for the uninitiated. It starts with a review of a set of files, which given the software I was using came in the form of either .html or .csv files. Both contain the same information displayed in different ways, so given my high level of comfort with Excel I chose to work with the .csv files. One file called “topic-words” contains lists of words associated with each topic. Another, called “topics-metadata”, presents a list of the documents in the corpus along with a decimal fraction representing “the proportion of words in the document that have been tagged with that label.”[ii] With some savvy sorting in Excel, I was able to shuffle the deck of topics-metadata per topic so that the topics heaviest in each document sorted to the top. I then read through the original letters referring back to the words in the topics to see if I could identify what the theme of each topic was.
As it turns out, it seemed as if I could. I found what appeared anecdotally to be clear themes in some and less clear but still suggestive themes in others. Feeling as if I got it “right,” I happily reported my findings back to the class and was met with interest as well as a difficult challenge from Dr. Alison Langmead to demonstrate how I knew I was “right.” To address this, I referenced Scott Enderle’s “Quickstart Guide”, which seemed to suggest to me that I was to use my intuition in cross-referencing between topics and themes in the original documents.[iii] I also called in Dr. Matthew Burton’s article “The Joy of Topic Modeling,” which effectively said the same. Later, I confounded myself even more by reading Miriam Posner’s blog, which acknowledged that “no part of the process is ‘scientific’”.[iv] And yet Alison remained firm: how did I know I was “right”?
I didn’t know how to answer that question, so I turned to the Humanities Data Librarian at the University of Pittsburgh’s Hillman Library, Tyrica Terry Kapral, for guidance and did some further reading. That further reading came to focus primarily on an article published by Karoliina Isoaho, Daria Gritsenko, and Eetu Mäkelä, thanks to which I became better able to understand that validating one’s output requires multiple steps. One of these steps is to interpret the model output and another includes validating one’s preprocessing decisions. A third step involves ensuring that the topics generated actually do “model the phenomenon under investigation.” These steps are presented by Isoaho, Gritsenko and Mäkelä as iterative and “intertwined”, and I indeed started with the second first.[v]
I’ve already described my first sets of preprocessing decisions, both in brief above and in greater detail in my second and third iterations. However, I made two additions to the regime mentioned previously. The first is that I added the words “work” and “copyright” to my list of stopwords. I did so because they are utilized with great regularity and repetition throughout the documents in my corpus, and because the relationships between content themes, topics and documents can affect some topic modeling output. Isoaho and her coauthors explained this relationship and its effect on the reliability of topic modeling output this well: “[Dirichlet distribution] is not able to model a collection well when a particular topic is consistently and widely present, while others appear together only rarely.” While the type of Dirichlet distribution that is used by MALLET is better at handling these varied concentrations of particular topics than others, I opted to add the words “work” and “copyright” to my stopwords list nonetheless. Topic modeling has been shown to work best when applied to corpuses comprised of documents numbering in the thousands. Mine numbered in the hundreds – roughly 170. Given that the pool in which my particular instantiation of MALLET was swimming was relatively small, I wanted to ensure that the waters were as smooth as possible, and therefore removed “work” and “copyright” from my corpus. I also, thanks again to Isoaho and friends, increased the number of topic words output from 20 (which was the default) to 35. “Summarizing with just the top N words what is in reality a distribution over all the words…” they write, “can hide important and interesting information.”[vi]
I then turned to the model output and set about to ensure that the results were stable. By this, I mean that there wasn't too much variation in the output each time I “clicked the button”. When running the model, I asked first for a set of three topics and then for a set of five. I made three of each request, meaning that I had in total three sets of three generated topics and three sets of five generated topics. I based these parameters on prior work reported in my second iteration, when I found that – likely due to the relatively small size of my corpus – a higher number of topics watered down the extent to which they reflected the documents.
Here is what I got when I ran a set of three:


And here is what I got when I ran a set of five:

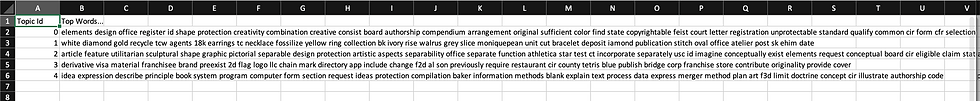

The order in which topics are returned is entirely arbitrary, but the order of the words within a topic is not. The first word in a topic is the word within that topic that is most strongly associated with that topic; the order descends from there. To ensure the stability of the topics, I confirmed that, for the most part, topics and terms seemed to remain the same across each set. I then moved on to check the stability of the distribution of the topics over the documents, and well as a distribution of the documents over the topics. To demonstrate this work, I will be using output from my run of three topics.
Specifically, I’ll be using the topics-metadata file. You can see a snapshot of it below. Each row represents a document. The columns reference the topics and the decimals refer to the proportion of words in each document that are tagged as being in each topic. Across the row and as you can see in Cell F4, they add up to 1, or a complete distribution of each document across each topic.
I applied conditional formatting in Excel to note in red font the topics to which over half of a given letter were associated, or – said another way – to note in red the predominant topic represented in each letter. I then sorted them by topic so that I could see which topic was the most represented across all of the letters and which was the least. I did this for each output in my set of three and then tallied them up so that I could make sure that they were somewhat consistent. As you can see in the table below, they were. Keeping in mind that the order of topics is random, you can actually ignore the column headers and just take note that the distributions in each row are relatively similar (if not exactly the same).
Topic 0 | Topic 1 | Topic 2 |
6 | 7 | 157 |
6 | 10 | 153 |
157 | 6 | 7 |
Another thing that I checked was how consistently topics were distributed across particular documents. To do a quick spot check, I scrolled down in the sorted metadata files and found the rows representing the documents that were more evenly distributed across all of the topics than the others. To confirm the consistency of this distribution, I checked this across all of my sorted metadata and found that, with some variation, the same letters did show up in this assortment. You’ll see this demonstrated below. In the following table, the cells filled in green represented the letters that were relatively evenly distributed across all three topics. Those in yellow represent those that were relatively evenly distributed across only two.

With all of this analysis done, I had exhausted all means that I could think of that could be used to verify that my results were stable (meaning, of course, that there was no significant variation in what was being output by MALLET). What would have come next for me was to select from my set of either three or five topics and then begin the process of semantic validation. Isoaho, Gritsenko and Mäkelä define this broadly as “reflect[ing] on the model output to evaluate its interpretability and plausibility.”[vii] In my case and in my next step, I would have evaluated the interpretability of the topics as generated by again returning to the letters themselves and checking between the words in topics and the content of the letters most strongly associated with each topic. However, the Isoaho article contained some other guidance that set me on a different course – one that involved stepping back to review the design of my project, and to begin to gather resources that might help me do a better job of research design in the future.
The goal stated in the abstract of Isoaho, Gritsenko and Mäkelä’s articleis to “encourage policy scholars to reflect carefully on methodological issues, and offer a simple heuristic to help identify and address critical points when designing a study using topic modeling.”[viii] I glossed over that when I selected the article from a database search, hoping instead to be able to use the piece to justify application of topic modeling to corpuses reflective of legal policies. However, I was rather stopped in my tracks by the methodological discussion the article offered. Working on a categorization framework developed by Stephen Titscher (et al.) in 2020, they distinguished between text analysis used for “content and classification” (or “C&C”; “characterized by the interest in words in single, compound or idiomatic terms”) and “discourse and representation” (or “D&R”; “characterized by the interest in meaning in communicative acts such as discourses”). They arrayed each in a table and per grouping of methodology type, recommended types and units of analysis. Per the same, they also recommended starting places (as in, starting with observation or starting with familiarization with one’s data) and the role – or possibility – of subjectivity in the study.[ix]
What I realized in reviewing this table is that the frame that I was going to use to guide my research should have been identified and centered as the first step in my work. From this frame, I could have moved onward to select an appropriate type and unit of analysis and could have been proactively prepared to address the questions of subjectivity that would arise as a result of my methodological decisions. Given that I didn’t do any of this, I wasn’t sure that my subjectivity – which is necessarily involved in the analysis of topic modeling results, given how manual the semantic validation step is – was properly accounted for. It is at this place of confusion and relative discomfort that my work on the project – at least so far as this semester is concerned – came to a halt. Now concerned with the effects that my unplanned process had on the results I was about to analyze, I had to stop and focus my efforts on gathering research methodology resources that can help me try – if possible, with any integrity – to retrofit an actual research design to what was otherwise a brazen but unstrategic wade into murky waters. The next steps that await me, therefore, are to read what I have collected about research design and reframe my project so that when I do get back around to the semantic validation that awaits, I can rest with some comfort in knowing – or at least having faith – that what conclusions I draw are founded in something outside of myself.
One of the great challenges that I have found in this digital humanities project has been striking the right balance between what the over-eager computer dutifully churns out and what I – the over-eager digital humanist who is guided by a brain that is equipped to infer almost anything – “discover”. While I started in what felt like a very mechanical world – downloading software, converting text, feeding raw materials into a machine, receiving the results on the other end and sorting them this way and that – I ended up in a world that was guided by human insight and judgement. As it happens, my first round of MALLET output (the one referenced in my third iteration) and my second round (the one referenced above) were very similar. As it also happens, I seem to have found my way to the “correct” path of analysis, per Isoaho, Gritsenko and Mäkelä’s table. If I had marched onward and analyzed my second set of results without the level of self-consciousness that this class helped me to develop, I may well have ended up with conclusions that were reliable-ish. However, it is because this “digital” method is so heavily inflected by things only humans can know (so far) that its output can be so difficult to justify as evidentiary or demonstrative. One must have higher standards than “reliable-ish.”
To be honest, my entries in my Mindful Practice Journal (MPJ) ground to almost a complete halt over these last few weeks. I made one final entry when I realized not only that I was no longer writing in it, but why: my process had come to be all about, well, my process. I became fixated on all that I failed to do and all that I needed to do right the next time and because I was no longer pushing buttons or processing data or pulling levers or receiving results, I didn’t think I was working on the “digital” project anymore. I thought I was just trying to correct an embarrassing mistake. It wasn’t until just a couple of days ago that I realized that what I was in fact doing was walking through the steps of understanding what Alison Langmead and her colleagues wrote in “A Role-Based Model for Successful Collaboration in Digital Art History.”[x] Effectively, their argument in that piece is that digital humanities projects can be very difficult, requiring sophisticated levels of expertise everything from data management, integrity and analysis to niche nooks of disciplinary specialty and information visualization. To manage such a project effectively, one needs either a suite of skills or a skilled team expert in very different areas. I hadn’t failed in achieving this so much as I needed to learn not that it was true but instead why it was true.
I leapt into my project as someone with a good amount of background knowledge of copyright law as well as a good understanding of the language and content of the letters used as my corpus. I also jumped in as someone with a prior career in data analysis, and as someone with the most bare-bones of basic coding skills. I also jumped in as someone who never designed a research project in her life and it shows. To do this on my own as the person I was at the start of this semester was absolutely an exercise in folly, and it couldn’t possibly have been more productive for me. I now know so much about what I don’t know – I have a whole stack of books and articles on research design awaiting me over the break and while I know I won’t emerge from that break an expert, I know that I will be able to at least talk more intelligently about the things I have yet to learn.
Rereading my MPJ, I can see now that at the start of this class, I knew that my task was to learn this thing: humans are involved in digital humanities. I knew to say that sentence and I knew to talk about it in the context of what we were reading and exploring. However, if learning that thing was the (or a) task, understanding not that it is true but why and how became my process. I started with a digital humanities project, tinkering away with software and file conversions, but I ended up a human making human mistakes while working on a humanities project. The digital faded, both because my path wound away from it but also because I realized that all the digital could do for me, really, was compute things more quickly than I could. Accounting for the human in my digital humanities project was where the work and the learning were to be found.
My frustrations took the shape of me not knowing what I didn’t know. Confoundingly, when Alison asked me to demonstrate how I knew that I was right, I realized I couldn’t. I didn’t know the answer to her question and I didn’t know what it was that I didn’t know. I spent more time than I liked in this Rumsfeldian conundrum but ultimately, and likely through a stroke of luck, found my way to Isoaho, Gritsenko and Mäkelä’s article. It was only after reading that a handful of times that I was able to begin to triangulate between it, other readings and my own experience to actually begin to understand not only how to better validate my results but also how important it is to ground one’s work methodologically before beginning.
My joys were found, admittedly, in pushing the buttons and “making the thing go ding,” by which I mean to say this: I did some things throughout the course of this project that previously I would have thought were hard. I worked on the command line, used Python to convert files, understood – however tentatively – some statistical language and at least tried to use my experiences to help others find their own way through their projects. Certainly, it was working with my peers in this course that was the true joy. As a student and a thinker still (and perhaps always) at the beginning of her path, I really do require the input and generosity of others to find my way to well-rounded understanding.
One of the most mundane but also most helpful things that I learned as a result of the course-long feedback structure of this class was that I tend to be inclined towards heady subjects and that when addressing them, I start in the middle. I do this when explaining my work and ideas to others, and I did it in my project design as well. I’m finding it a hard thing to address because I don’t know until I have made the same mistake that, indeed, I have made the same mistake. Knowing that I have requires the input of others. Gratefully, that input coming from my cohort in DSAM 3000 was encouraging and also helped me to understand where it is likely that other people’s understanding of copyright law in particular might begin and end. All of this insight will be invaluable to me as I begin to turn this work into something that I, first, submit for presentation at the 2022 annual workshop of the International Society for the History and Theory of Intellectual Property and, second, submit as part of my Preliminary Examination Portfolio. Beginning my work at the correct distance from particular subjects and depending on my particular audiences will be an interesting challenge for me, but I know now that I will be facing that challenge with an awareness of my quirks as a scholar. That more nuanced self-awareness has been one of the greatest gifts of this course.
It is perhaps only in a course like this one that I can conclude by enumerating my mistakes, oversights and skills-yet-to-be-developed and feel content with the quality of my effort. While what I have to show for myself might be a project taken apart and in need of being put back together again, I know that what I ultimately take away is a better understanding of where I stand on my path.
Works Cited
[i] Theodore Underwood, “Topic Modeling Made Just Simple Enough.,” The Stone and the Shell (blog), April 7, 2012, https://tedunderwood.com/2012/04/07/topic-modeling-made-just-simple-enough/. [ii] Scott Enderle, “Quickstart Guide,” Topic Modeling Tool Blog, January 6, 2017, https://senderle.github.io/topic-modeling-tool/documentation/2017/01/06/quickstart.html. [iii] Enderle. [iv] Matthew Burton, “The Joy of Topic Modeling: A Bag of Words by Matt Burton,” n.d., http://mcburton.net/blog/joy-of-tm/; Miriam Posner, “Very Basic Strategies for Interpreting Results from the Topic Modeling Tool – Miriam Posner’s Blog,” accessed December 14, 2021, https://miriamposner.com/blog/very-basic-strategies-for-interpreting-results-from-the-topic-modeling-tool/. [v] Karoliina Isoaho, Daria Gritsenko, and Eetu Mäkelä, “Topic Modeling and Text Analysis for Qualitative Policy Research,” Policy Studies Journal 49, no. 1 (2021): 306, https://doi.org/10.1111/psj.12343. [vi] Isoaho, Gritsenko, and Mäkelä, 306.
[vii] Isoaho, Gritsenko, and Mäkelä, 307. [viii] Isoaho, Gritsenko, and Mäkelä, 300. [ix] Isoaho, Gritsenko, and Mäkelä, 308. [x] Alison Langmead et al., “A Role-Based Model for Successful Collaboration in Digital Art History,” International Journal for Digital Art History, no. 3 (July 27, 2018), https://doi.org/10.11588/dah.2018.3.34297.

Comments